

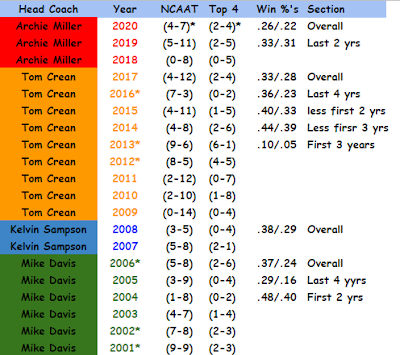
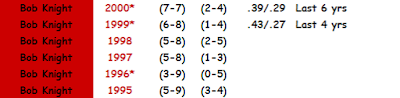
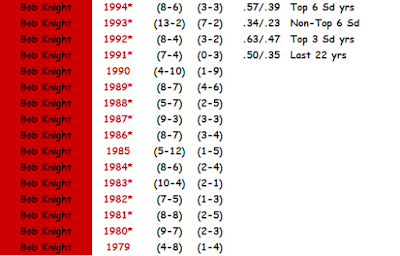
A post below got me thinking about how comparing win percentages can be pretty dependent on schedule strength. I did this thing a couple of years ago where I looked only at games vs NCAA Tournament qualifiers, then at only games vs teams who earned a Top 4 seeding. I had to do a little updating, but here's what I've got going back to the 1995 season.
Out in the Win % column, the first number is win % vs NCAA qualifiers and the 2nd number is vs Top 4 seeds. The asterisk in the year column denotes seasons in which IU received a #6 seed or better. I think the rest is self explanatory. Anyway, if we look at only those seasons where IU got a #6 seed or better, IU was just a smidge under 50% vs Tournament qualifiers and about 37% vs Top 4 seeds. I'm thinking that this would be a minimal performance target to Keep fans from being too restless.
Out in the Win % column, the first number is win % vs NCAA qualifiers and the 2nd number is vs Top 4 seeds. The asterisk in the year column denotes seasons in which IU received a #6 seed or better. I think the rest is self explanatory. Anyway, if we look at only those seasons where IU got a #6 seed or better, IU was just a smidge under 50% vs Tournament qualifiers and about 37% vs Top 4 seeds. I'm thinking that this would be a minimal performance target to Keep fans from being too restless.
Last edited:
