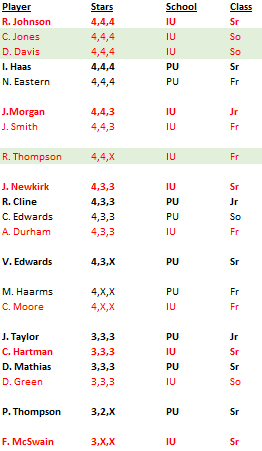
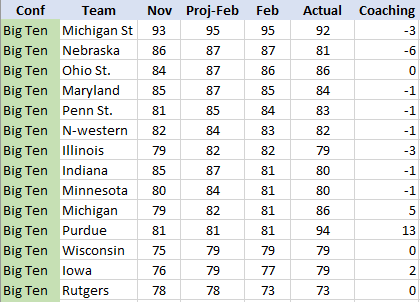
Btw, here is the updated Big Ten chart. The roster scores have all been converted to an approx. Sagarin Rating. Up until this season, I had given out hard copies to some people at work and they liked the conversion to Sagarin better than a lot of numbers that I had to explain.
Hopefully, it's pretty much self explanatory, but here's a brief rundown. The November column is just the starting point for each team at the beginning of the season.
Depending on the youthfulness of the roster, some teams can be expected to improve more than others as the season progresses. The Projected February column is attempt to predict the improvement by the time February rolls around.
The third column (February) is where I recalculate based on which players are actually getting the real life minutes. Injuries, transfers and recruiting busts can sometimes drastically alter those November expectations.
The fourth column (actual) is just the current real-life Sagarin Rating. I usually just do this at Tournament time, but I went ahead and plugged it in so you could see how it works.
The last column is called Coaching, because it captures the difference between expectations and reality. Right or wrong, I either blame or applaud coaches for the number in this column. Where IU is concerned I usually will dig much deeper to try to understand what went right or wrong, but I don't have time for that for the rest of the country... vbg
Since I've been doing this Painter and Beilein have typically far exceeded the rosters. They've each had a failure or two here and there, but this year is fairly common. One thing I like about IU is over the last 10 games they are averaging an 84 performance level, whereas the first 15 games they only averaged 76.
Anyway... here it is... and the teams are sorted by the Feb column, which is the roster strength as of Feb. 2nd. This goes against my "bottom 4" comment earlier in the thread, but I mentally (out of habit) always move Painter and Beilein a few notches, which puts IU among the bottom rungers.