ADVERTISEMENT

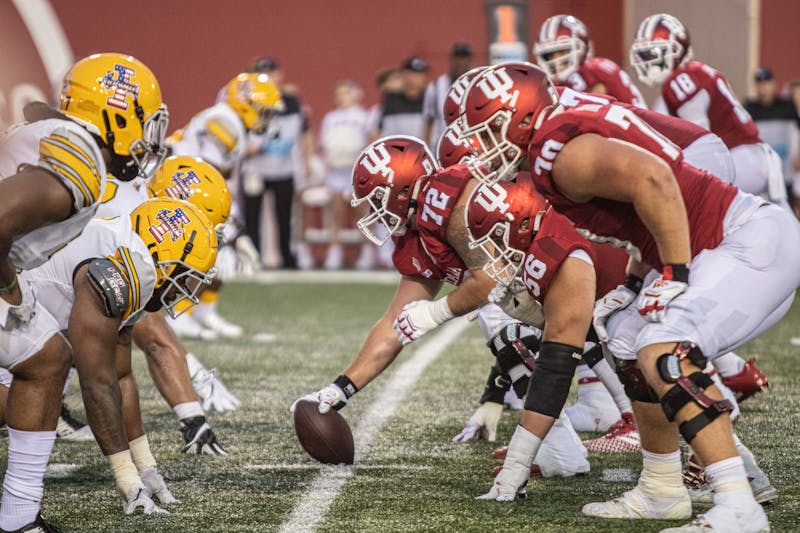
What is up with the OL?

82hoosier

All-American
Sep 7, 2001
9,681
8,122
113
Attached is an excellent article written November 4 that appeared in the IDS. It was written with four games to go in the season. The results of those last four games were as follows:

lost at Michigan 29-7
lost to Rutgers 38-3
lost to Minnesota 35-14
lost at Purdue 44-7

i can’t find a grading of the OL through the end of the season. But have to think that the season end assessments were even worse.
 
  • Like
Reactions: red hornet
Thanks for the link.

IMO, no one plays mean on the OL.

It's been said on the forum that guys like Deboer knew how to play with bad talent, as if the line was suspect back then. I couldn't disagree more. Wes Martin, Simon Stepaniak, & Brandon Knight were NFL linemen. And Wes & Step in particular played like big rough sons of guns. I don't see anyone who played OL last year that really whipped anyone on the regular or seemed like they would take any pleasure in it if they did.

My case in point below (starting at the 19:00 mark). Step buried Winovich and went in for seconds. Especially after Winovich stepped on his calf the play before, I don't think Step shed a single tear about Winovich going down.

 
Besides Caleb Jones, are all the other OL returning? Is Dylan Powell leaving?

Here is a list of Stars and Ratings. I had thought our recruiting OL had improved the last two classes, but besides DJ Moore, the rest are rated similar to previous classes.

With returning experience from four OL and some young talent in the wings, hopefully we can see improvement next year. Who is most likely to be able to show the mean streak that we have been missing? Who from the list that hasn't played much will push for playing time next year? Benson, Sales?

ClassPlayerStarsRating
2022DJ Moore45.8
2022Bray Lynch35.6
2022Carter Smith35.5
2021Josh Sales35.6
2021Vinny Fiacable35.5
2021Zach Carpenter (Transfer)35.7starter
2020Chris Bradberry (Juco)25.3
2020Kahlil Benson35.7
2020Luke Haggard (Juco)35.5starter
2020Randy Holz35.5
2020Brady Feeney35.5
2020Cameron Knight35.5
2020Luke Wiginton35.6
2020Dylan Powell (Transfer)35.6Gone?
2019Tim Weaver25.4
2019Michael Katic35.5starter
2019Matthew Bedford356starter
2018Aidan Rafferty35.7
2018Nick Marozas35.6

I think Powell is done.
 
  • Like
Reactions: vesuvius13

Here are the stats from a service I use. Its explained on the top with the categories and rank of each category below.​

Run-blocking stats​

  • Line Yards per Carry: For 2018, we are experimenting with a new definition for college line yardage based on film study and generalization. Instead of the ALY figure FO used for the NFL, this one is tighter: the line gets credit for rushing yardage between 0-3 yards (instead of 0-4) and 50% credit for yards 4-8 (instead of 5-10). Anything over 8 yards is quantified as a highlight opportunity, and credit goes to the runner. As with the pro definition, lost yardage still counts for 125%. (Garbage time is filtered out for all line yardage averages.)
  • Standard Downs Line Yards per Carry: The raw, unadjusted per-carry line yardage for a team on standard downs (first down, second-and-7 or fewer, third-and-4 or fewer, fourth-and-4 or fewer).
  • Passing Downs Line Yards per Carry: The same unadjusted averages for rushing on passing downs.
  • Opportunity Rate: The percentage of carries (when four yards are available) that gain at least four yards, i.e. the percentage of carries in which the line does its job, so to speak.
  • Power Success Rate: This is the same as on the NFL side -- percentage of runs on third or fourth down, two yards or less to go, that achieved a first down or touchdown.
  • Stuff Rate: Same as STUFFED on the NFL side -- percentage of carries by running backs that are stopped at or before the line of scrimmage.

Pass-blocking stats​

  • Sack Rate: Unadjusted sack rate for all non-garbage time pass attempts.
  • Standard Downs Sack Rate: Unadjusted sack rate for standard downs pass attempts.
  • Passing Downs Sack Rate: Unadjusted sack rate for passing downs pass attempts.
OffenseAvg. Line YardsRkStd. Downs Line YardsRkPass. Downs Line YardsRkOpp. RateRkPower Success RateRkStuff RateRkSack RateRkStd. Downs Sack RateRkPass. Downs Sack RateRk
Indiana
2.35​
119​
2.14​
126​
2.92​
66​
43.50%​
110​
69.20%​
66​
17.90%​
68​
7.50%​
91​
6.00%​
83​
8.20%​
69​


...
Coach Hiller needs to teach the OL some toughness and willingness to get after the defensive players.
 
  • Like
Reactions: red hornet
ADVERTISEMENT
ADVERTISEMENT