

Colleges
- AAC
- ACC
- Big 12
- Big East
- Big Ten
- Pac-12
- SEC
- Atlantic 10
- Conference USA
- Independents
- Junior College
- Mountain West
- Sun Belt
- MAC
- More
- Navy
- UAB
- Tulsa
- UTSA
- Charlotte
- Florida Atlantic
- Temple
- Rice
- East Carolina
- USF
- SMU
- North Texas
- Tulane
- Memphis
- Miami
- Louisville
- Virginia
- Syracuse
- Wake Forest
- Duke
- Boston College
- Virginia Tech
- Georgia Tech
- Pittsburgh
- North Carolina
- North Carolina State
- Clemson
- Florida State
- Cincinnati
- BYU
- Houston
- Iowa State
- Kansas State
- Kansas
- Texas
- Oklahoma State
- TCU
- Texas Tech
- Baylor
- Oklahoma
- UCF
- West Virginia
- Wisconsin
- Penn State
- Ohio State
- Purdue
- Minnesota
- Iowa
- Nebraska
- Illinois
- Indiana
- Rutgers
- Michigan State
- Maryland
- Michigan
- Northwestern
- Arizona State
- Oregon State
- UCLA
- Colorado
- Stanford
- Oregon
- Arizona
- California
- Washington
- USC
- Utah
- Washington State
- Texas A&M
- Auburn
- Mississippi State
- Kentucky
- South Carolina
- Arkansas
- Florida
- Missouri
- Ole Miss
- Alabama
- LSU
- Georgia
- Vanderbilt
- Tennessee
- Louisiana Tech
- New Mexico State
- Middle Tennessee
- Western Kentucky
- UTEP
- Florida International University
High School
- West
- Midwest
- Northeast
- Southeast
- Other
- Alaska
- Arizona
- California
- Colorado
- Nevada
- New Mexico
- Northern California
- Oregon
- Southern California Preps
- Washington
- Edgy Tim
- Indiana
- Kansas
- Nebraska
- Iowa
- Michigan
- Minnesota
- Missouri
- Oklahoma Varsity
- Texas Basketball
- Texas
- Wisconsin
- Delaware
- Maryland
- New Jersey Basketball
- New Jersey
- New York City Basketball
- Ohio
- Pennsylvania
- Greater Cincinnati
- Virginia
- West Virginia Preps
ADVERTISEMENT
Install the app
How to install the app on iOS
Follow along with the video below to see how to install our site as a web app on your home screen.
Note: This feature may not be available in some browsers.
You are using an out of date browser. It may not display this or other websites correctly.
You should upgrade or use an alternative browser.
You should upgrade or use an alternative browser.
Excessive Deaths
- Thread starter NPT
- Start date
Yeah no kidding. Slowly but surely sorting out the social security problemLarge number of the old and infirm have been killed off already?

You know I have wondered if that could at least be a contributor.Large number of the old and infirm have been killed off already?
If I had to make an out of my ass guess, I'd say it's covid vaccines slowing down the virus while we are still somewhat using covid precautions (masking, distance, not driving to social places).
One of the rants I hear from my far right friends is 'have you noticed that the flu has basically disappeared??!!' in some sort of covid is just a bad flu argument.
The answer is yeah, because when you put up a defense against Godzilla, a benefit is that it works against snake attacks also.
Anyway that would be my guess, or some kind of rebalancing as previously mentioned (as those that might have normally died have already died last year).
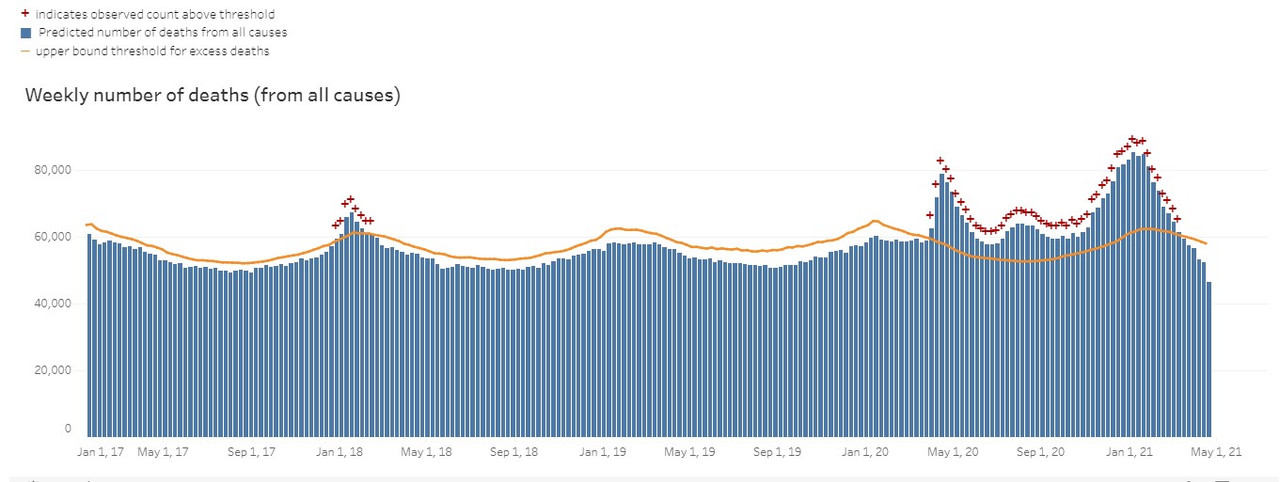
That's not actually what the graph shows. The yellow line is not "normal." It is the upper bound of the 95% confidence interval.If you look at the following graph you can see that for the last couple months the number of deaths in the US has been less than normal. Has anyone see an explanation as to why that is? That graph is at the bottom of this page at the CDC.
However, Mark's answer might still be valid as a cause for deaths dropping back below that threshold.
If you look at the following graph you can see that for the last couple months the number of deaths in the US has been less than normal. Has anyone see an explanation as to why that is? That graph is at the bottom of this page at the CDC.
NPT, aside from Goat's point above, you have to remember the lag effect of this data. Anything within the last month is only going to be revised further upwards. That doesn't mean we haven't seen the beginning of a reversion towards the mean, but keep that in mind.
Another aspect that is nearly impossible to quantify is the delay in elective and even critical procedures due to lockdowns, patient hesitancy, etc.
Even worse, it will be impossible to quantify the long-term impact on global health because of the restrictions of physical activity and increase in long-term mental illness. We haven't been to the gym in well over a year and while I've attempted to do some moderate exercises at home, get outside and do more outdoor activity, etc. my cardio and physical health is far worse in Spring 2021 after a year of COVID than Spring 2020.
You would think that would cause more deaths wouldn't you? People not going to the doctor or getting a procedure done when they should has been mentioned as part of the excessive deaths.Another aspect that is nearly impossible to quantify is the delay in elective and even critical procedures due to lockdowns, patient hesitancy, etc.
I am interested in whether the numbers will be revised upwards.
Very obvious....Deaths started going down when Biden took office. He is the Chuck Norris of Presidents.If you look at the following graph you can see that for the last couple months the number of deaths in the US has been less than normal. Has anyone see an explanation as to why that is? That graph is at the bottom of this page at the CDC.
Or when T.rump allowed himself to be voted out of office so he could return to his role as Batman.Very obvious....Deaths started going down when Biden took office. He is the Chuck Norris of Presidents.
You would think that would cause more deaths wouldn't you? People not going to the doctor or getting a procedure done when they should has been mentioned as part of the excessive deaths.
I am interested in whether the numbers will be revised upwards.
Of course that is some percentage of the excess. Quantifying it is the problem. But, my larger point was, our excess deaths trendline may rise for a while and I certainly expect life expectancy to fall for the foreseeable future.
I don't know of anyone who predicted this, NO ONE I tell ya ! freaking miracle I say.Very obvious....Deaths started going down when Biden took office. He is the Chuck Norris of Presidents.
All the fake deaths add up. Truly diabolical. Fauci is like Dr Evil.I don't know of anyone who predicted this, NO ONE I tell ya ! freaking miracle I say.
One of my best friends is a pathologist who for many years has complained about coroners and death reports.
Please qualify this by pointing out his experience is limited to Marion County,Indiana.
Nevertheless, i cannot believe that death reporting problems exist outside of Marion County.
At the risk of being called a big government liberal, can I suggest having national standards which are adhered to might help in regard to the death statistics regarding the impact of Covid.
Yep. Takes a month or two for numbers to catch up to reality.NPT, aside from Goat's point above, you have to remember the lag effect of this data. Anything within the last month is only going to be revised further upwards. That doesn't mean we haven't seen the beginning of a reversion towards the mean, but keep that in mind.
Another aspect that is nearly impossible to quantify is the delay in elective and even critical procedures due to lockdowns, patient hesitancy, etc.
Even worse, it will be impossible to quantify the long-term impact on global health because of the restrictions of physical activity and increase in long-term mental illness. We haven't been to the gym in well over a year and while I've attempted to do some moderate exercises at home, get outside and do more outdoor activity, etc. my cardio and physical health is far worse in Spring 2021 after a year of COVID than Spring 2020.
That being said, whatever problems exist are baked into both the trend line and the 95% prediction range, so significant deviations from either - especially when they can be linked with specific real-world events expected to affect mortality - are unlikely to be statistical artifacts or false positives. In other words, it's extremely unlikely that we just happen to see spikes associated with a bad 2018 flu season and the Covid pandemic and that those spikes don't exist in reality.One of my best friends is a pathologist who for many years has complained about coroners and death reports.
Please qualify this by pointing out his experience is limited to Marion County,Indiana.
Nevertheless, i cannot believe that death reporting problems exist outside of Marion County.
At the risk of being called a big government liberal, can I suggest having national standards which are adhered to might help in regard to the death statistics regarding the impact of Covid.
That's true...when I've seen where someone has called Covid a hoax I've pointed them to the graph and pointed out that it shows the bad 2018 flu season and then point out all the excessive deaths since Covid hit.That being said, whatever problems exist are baked into both the trend line and the 95% prediction range, so significant deviations from either - especially when they can be linked with specific real-world events expected to affect mortality - are unlikely to be statistical artifacts or false positives. In other words, it's extremely unlikely that we just happen to see spikes associated with a bad 2018 flu season and the Covid pandemic and that those spikes don't exist in reality.
Chuck Marlowe...of non-PresidentdVery obvious....Deaths started going down when Biden took office. He is the Chuck Norris of Presidents.
There are deaths that attributed to Covid that aren't caused by Covid but the graph tells the story. My sister (87) died last year and it had Covid as a reason on the death certificate but it wasn't a cause at all. She had it probably 7-8 before but didn't have any symptoms but then fell and broke her hip and that started the downward spiral to her deathAll the fake deaths add up. Truly diabolical. Fauci is like Dr Evil.
Similar threads
- Replies
- 56
- Views
- 1K
- Replies
- 84
- Views
- 1K
- Replies
- 87
- Views
- 1K
- Replies
- 181
- Views
- 3K
ADVERTISEMENT
ADVERTISEMENT