ADVERTISEMENT

the economy

IU1

Hall of Famer
Apr 3, 2002
10,888
123
63
I was reading an article in the USA Today about one the sharpest declines in wage growth history and one sentence stuck out to me as to why I can't stand reading bullet point main-stream-economist-media.
Economists have been puzzled by the failure of wages to rise at a faster pace despite a near-normal 5.3% unemployment rate and a shrinking pool of available workers.
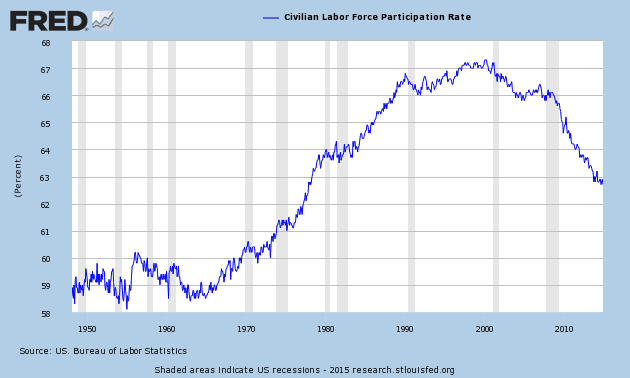
A "near-normal 5.3% unemployment rate and a shrinking pool of available workers?" Are they kidding? We have 93,000,000 people out of the labor force, a number not seen since the Carter administration, making the unemployment rate number farcical.

LFPR-Fred-image.png


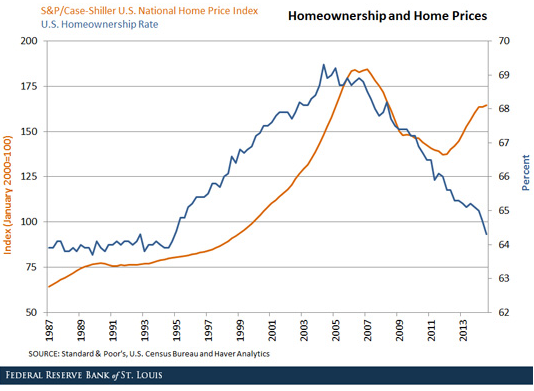
As bad economic indicators pile up, there are a few easy to understand measurables that show just howtUS homeownership has dropped to it's lowest levels since 1967. It's even worse for millenials, with an all-time record high of that generation living at home with their parents and a disproportionately higher unemployment rate.
US-homeownership-v-home-price_StLouisFed.png


Obviously during the housing boom, we over built or used up future housing growth, so the numbers needed to drop because there were people owning homes who couldn't afford them, it was an artificial market. And thus came a natural market correction. But with appropriate economic policy, by now the housing bust should have leveled off and prices should not be increasing. This also has the effect of increasing rents. No wonder millenials are living at home, they can't afford housing.

So 7 years into the Obama administration and 5 years into ZIRP and we've got no growth in housing but higher rents, falling wages, no middle class, and with that comes the obvious lack of consumer confidence.

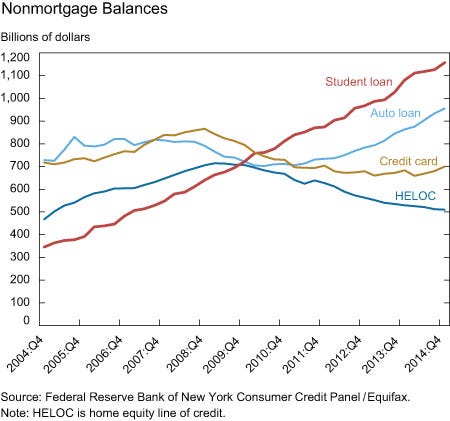
What's even scarier is the crushing $1.2T in student loan debt that will have to be repaid by millenials. Looking at this chart we see that student loan and auto loan debt is increasing and credit card is moving in that direction. The reality is we've still over borrowed as a consumer base and can't handle the debt service.
student-loan-debt.jpg


Naturally with no real long term well paying jobs with benefits being created there is nowhere for these new graduates to work and it won't be long before serious pressure is on Congress and a future President as to whether they should bailout these student loans and forgive them at taxpayer expense.

What's really troubling is the FED can't lower rates any more. They talk about a rate increase which is exactly what they should have done a while ago because ZIRP isn't working and it's punishing the savers and temporarily benefitting large corporations that inflate the stock market with stock buy backs. But there is no way the FED will increase rates anytime soon as they will come up with a multitude of excuses while also claiming the economy is in a recovery.

We should have had a lot more traction by now, instead we're coming down from a sugar high. This is going to be a lost decade if Congress doesn't get serious about job creation and small business and middle class friendly policies that create quality jobs. We also need a complete different course of direction from the FED. I can only hope our next President really understands how business works and how to create jobs.
 
Last edited:
  • Like
Reactions: stollcpa
The obvious policy response when monetary policy is constrained by the ZLB: aggressive fiscal policy. Instead we've implemented contractionary fiscal policies since 2010.

313467-13329490942599604-One-Eyed-Guide_origin.jpg


NewGovtJobs2.jpg


See here and here.

Republicans are almost entirely to blame for this, having regarded textbook macroeconomics as a liberal plot and forestalling any effort to promote growth since they took the House and brought policy-making to an end. Stupid, stupid, stupid.

By the way, interest rates? Inflation?
 
I was reading an article in the USA Today about one the sharpest declines in wage growth history and one sentence stuck out to me as to why I can't stand reading bullet point main-stream-economist-media.

Economists have been puzzled by the failure of wages to rise at a faster pace despite a near-normal 5.3% unemployment rate and a shrinking pool of available workers.
A "near-normal 5.3% unemployment rate and a shrinking pool of available workers?" Are they kidding? We have 93,000,000 people out of the labor force, a number not seen since the Carter administration, making the unemployment rate number farcical.

LFPR-Fred-image.png


As bad economic indicators pile up, there are a few easy to understand measurables that show just howtUS homeownership has dropped to it's lowest levels since 1967. It's even worse for millenials, with an all-time record high of that generation living at home with their parents and a disproportionately higher unemployment rate.

US-homeownership-v-home-price_StLouisFed.png


Obviously during the housing boom, we over built or used up future housing growth, so the numbers needed to drop because there were people owning homes who couldn't afford them, it was an artificial market. And thus came a natural market correction. But with appropriate economic policy, by now the housing bust should have leveled off and prices should not be increasing. This also has the effect of increasing rents. No wonder millenials are living at home, they can't afford housing.

So 7 years into the Obama administration and 5 years into ZIRP and we've got no growth in housing but higher rents, falling wages, no middle class, and with that comes the obvious lack of consumer confidence.

What's even scarier is the crushing $1.2T in student loan debt that will have to be repaid by millenials. Looking at this chart we see that student loan and auto loan debt is increasing and credit card is moving in that direction. The reality is we've still over borrowed as a consumer base and can't handle the debt service.

student-loan-debt.jpg


Naturally with no real long term well paying jobs with benefits being created there is nowhere for these new graduates to work and it won't be long before serious pressure is on Congress and a future President as to whether they should bailout these student loans and forgive them at taxpayer expense.

What's really troubling is the FED can't lower rates any more. They talk about a rate increase which is exactly what they should have done a while ago because ZIRP isn't working and it's punishing the savers and temporarily benefitting large corporations that inflate the stock market with stock buy backs. But there is no way the FED will increase rates anytime soon as they will come up with a multitude of excuses while also claiming the economy is in a recovery.

We should have had a lot more traction by now, instead we're coming down from a sugar high. This is going to be a lost decade if Congress doesn't get serious about job creation and small business and middle class friendly policies that create quality jobs. We also need a complete different course of direction from the FED. I can only hope our next President really understands how business works and how to create jobs.

LOL. Congress needs to get out of the way, not create more bullshit legislation.

And LOL @ you calling out the Fed. If it were up to you, the Fed would have raised rates to 5% and sent the economy into a depression worse than 1929.
 
  • Like
Reactions: twenty02
I was reading an article in the USA Today about one the sharpest declines in wage growth history and one sentence stuck out to me as to why I can't stand reading bullet point main-stream-economist-media.

Economists have been puzzled by the failure of wages to rise at a faster pace despite a near-normal 5.3% unemployment rate and a shrinking pool of available workers.
A "near-normal 5.3% unemployment rate and a shrinking pool of available workers?" Are they kidding? We have 93,000,000 people out of the labor force, a number not seen since the Carter administration, making the unemployment rate number farcical.

LFPR-Fred-image.png


As bad economic indicators pile up, there are a few easy to understand measurables that show just howtUS homeownership has dropped to it's lowest levels since 1967. It's even worse for millenials, with an all-time record high of that generation living at home with their parents and a disproportionately higher unemployment rate.

US-homeownership-v-home-price_StLouisFed.png


Obviously during the housing boom, we over built or used up future housing growth, so the numbers needed to drop because there were people owning homes who couldn't afford them, it was an artificial market. And thus came a natural market correction. But with appropriate economic policy, by now the housing bust should have leveled off and prices should not be increasing. This also has the effect of increasing rents. No wonder millenials are living at home, they can't afford housing.

So 7 years into the Obama administration and 5 years into ZIRP and we've got no growth in housing but higher rents, falling wages, no middle class, and with that comes the obvious lack of consumer confidence.

What's even scarier is the crushing $1.2T in student loan debt that will have to be repaid by millenials. Looking at this chart we see that student loan and auto loan debt is increasing and credit card is moving in that direction. The reality is we've still over borrowed as a consumer base and can't handle the debt service.

student-loan-debt.jpg


Naturally with no real long term well paying jobs with benefits being created there is nowhere for these new graduates to work and it won't be long before serious pressure is on Congress and a future President as to whether they should bailout these student loans and forgive them at taxpayer expense.

What's really troubling is the FED can't lower rates any more. They talk about a rate increase which is exactly what they should have done a while ago because ZIRP isn't working and it's punishing the savers and temporarily benefitting large corporations that inflate the stock market with stock buy backs. But there is no way the FED will increase rates anytime soon as they will come up with a multitude of excuses while also claiming the economy is in a recovery.

We should have had a lot more traction by now, instead we're coming down from a sugar high. This is going to be a lost decade if Congress doesn't get serious about job creation and small business and middle class friendly policies that create quality jobs. We also need a complete different course of direction from the FED. I can only hope our next President really understands how business works and how to create jobs.
I know many that are under employed or have had their hours cut to less than 40 hours with their salary reduced accordingly. They aren't unemployed, but they are looking for jobs that would restore what they lost. One person can't find anything better in his area of expertise. He would have to start out in a new field and hope the job grows to replace what he lost.

Millennials are not buying homes and they are not getting married and setting up new households. Kids starting out boosts the economy by their spending on items needed to live on their own. By my son's age, I was married and had bought my first house. My son graduated from college and got a job in his field. Pay in his field has not been going up and has actually fallen since he started college in 2009. I encourage him to live at home while he saves money and focuses on getting his career established. This is keeping him from getting serious with someone and thinking about marriage and family.

I blame the current situation on a lot of things. ACA was a fine idea but should have been done once we had a real recovery. Forcing insurance coverage and increased insurance premiums were hard on those that did not have a parent's insurance to stay on until 26. The move by many to not expand and be required to supply insurance under ACA hurt growth. Then there are the companies that went to more part time help than hire full time people. These people come off the list of unemployed, but they are often not earning enough to run a household.

My daughter is in college. She is available to work 40 hours per week in her summer job. They can only give her 30 hours because the university she is working for would be required to offer her insurance. She doesn't need their insurance and wouldn't sign up, but they have to follow their rules. She is making 75% of what she would have made in the same job a few years ago.
 
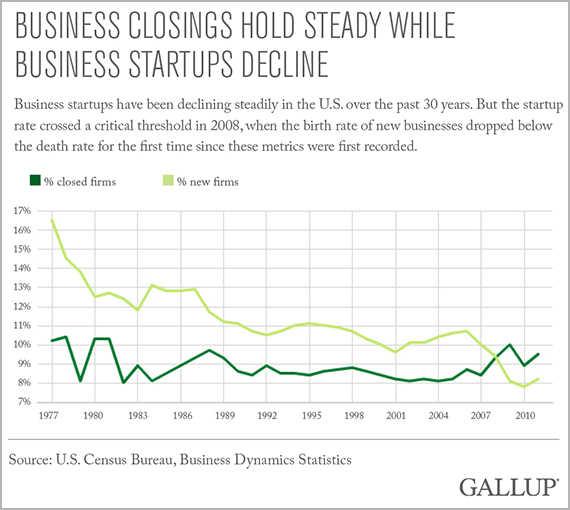
Seems like the data is only thru 2011

616sgtntbeas692w57hlvq.jpg


Perhaps I am missing something
Chart shows exactly what I said. since 2008 more businesses have closed than new ones opening. Dark Green = Closed and Light Green = New Firms
 
Chart shows exactly what I said. since 2008 more businesses have closed than new ones opening. Dark Green = Closed and Light Green = New Firms

Of course you mean since the Great Recession hit . . .

. . . well duh . . .

. . . I'd bet donuts to dollars that this also happened during the Great Depression if you were to include family farms as "businesses".
 
Chart shows exactly what I said. since 2008 more businesses have closed than new ones opening. Dark Green = Closed and Light Green = New Firms
So your statement is accurate up to 4.5 years ago?

As I recall we were coming out of the sh!tter at about that time and both lines on the chart show an up tick.

Are businesses still closing faster than new ones are opening?

Or is this a: "Franco is still dead moment"?
 
I cringe every time I see the 93/92 MM number. It almost always misrepresented.

My mother-in-law worked four years of he life even though she had a college degree. My wife moved from full time to part time when our son entered kindergarten. She estimated that a third of the households in our son''s class had a parent that stayed at home. Our daughter's class was over 50%.

We have a larger retiree population. That is part baby boom and part longevity. That increases non workers.

Of the 92MM, only about six MM are looking at jobs. My wife will be in her 50s when we retire. I have no issue with that. There is a frequent poster that retired in his early 50s, if I read correctly. That is a sign of success.

I just ran into a woman that I worked with for years. She was always busy at work and did not marry until her 50s. We were concerned about her move to retirement. She has become involved with a few non-profits.

The not working statistic is helpful. The employment surveys are critical to understand why the numbers are what they are. I recently linked a study by one of the Fed banks noting that the surveys showing frustration with job opportunities flhaving an impact on joblesness through 2011. After 2012 exiting the workforce was due to disability and retirement.

I will retire at a reasonable age until Jeb! Tears my pension check from my cold, dead hands.
 
  • Like
Reactions: twenty02
Millennials are not buying homes and they are not getting married and setting up new households. Kids starting out boosts the economy by their spending on items needed to live on their own. By my son's age, I was married and had bought my first house. My son graduated from college and got a job in his field. Pay in his field has not been going up and has actually fallen since he started college in 2009. I encourage him to live at home while he saves money and focuses on getting his career established. This is keeping him from getting serious with someone and thinking about marriage and family.

Perhaps generational preference is part of the problem as well. People aren't eager to settle down right away and tend to pursue selfish (I don't mean that in a negative way) endeavors (e.g. travel, hobbies, exploring various jobs, etc.)
 
Chart shows exactly what I said. since 2008 more businesses have closed than new ones opening. Dark Green = Closed and Light Green = New Firms

No it doesn't. It clearly does not indicate the trend anywhere near the present.
 
Chart shows exactly what I said. since 2008 more businesses have closed than new ones opening. Dark Green = Closed and Light Green = New Firms


You needed a news story and a chart to know that more businesses closed between 2008 and 2011 than opened?

That explains a lot...
 
What exactly are the fiscal and monetary policy policies should have been followed, IU1? Higher interest rates? Lol.

The Fed has done a hell of a job over these last 7 years. So good, that other monetary policy makers have been playing catchup trying to copy it. Thank goodness, because the fiscal policy making by politicians has been atrocious.
 
Chart shows exactly what I said. since 2008 more businesses have closed than new ones opening. Dark Green = Closed and Light Green = New Firms

Hmmm...why was 2008 picked? Is it to subtly imply that it's President Obama's fault? Or did they pick 2008 because of the crash that happened under republican rule and President Obama was left to preside over the mess? A mess we still aren't out of, but at least President Bush made sure his banking buddies came out alright before he left office. His banking buddies that caused the crisis in the first place, but let's pile on GM for getting helped. GM is the real crook here. Don't focus on the criminals on Wall Street!!! Look, over there!!! Those working folks at GM make too much money!!! They're greedy!!!
 
The obvious policy response when monetary policy is constrained by the ZLB: aggressive fiscal policy. Instead we've implemented contractionary fiscal policies since 2010.

313467-13329490942599604-One-Eyed-Guide_origin.jpg


NewGovtJobs2.jpg


See here and here.

Republicans are almost entirely to blame for this, having regarded textbook macroeconomics as a liberal plot and forestalling any effort to promote growth since they took the House and brought policy-making to an end. Stupid, stupid, stupid.

By the way, interest rates? Inflation?
What exactly are the fiscal and monetary policy policies should have been followed, IU1? Higher interest rates? Lol.

The Fed has done a hell of a job over these last 7 years. So good, that other monetary policy makers have been playing catchup trying to copy it. Thank goodness, because the fiscal policy making by politicians has been atrocious.
Federal Reserve policies are primarily responsible for the largest income gap in 100 years and we currently have 93,000,000 out of work and an unsustainable consumer debt situation with the only benefactor of FED policies being corporations inflating the stock market with stock buybacks. Which part of that is the great job?
 
Federal Reserve policies are primarily responsible for the largest income gap in 100 years and we currently have 93,000,000 out of work and an unsustainable consumer debt situation with the only benefactor of FED policies being corporations inflating the stock market with stock buybacks. Which part of that is the great job?

Establish a logical basis for each of the following:
- "Reserve policies are primarily responsible for the largest income gap in 100 years."
- "We currently have 93 million [presumably active job seekers] out of work."
- "We currently have an unsustainable consumer debt situation."
- "The only benefactor of FED policies being corporations inflating the stock market with stock buybacks."
and, separately,
- "Corporations [are] inflating the stock market with stock buybacks."

Please show your work.

It's impossible for him to, because it's emotionally based econ- thought...similar to what one might find at infowars.com
 
It's impossible for him to, because it's emotionally based econ- thought...similar to what one might find at infowars.com

Well, I thought breaking it down might be helpful, so he could focus on one of those statements at a time.

Let's see what he does with them . . . if he bloviates then we'll know there's still no need to pay attention. If he actually comes up with some hard logic supported by reasonably sourced and verifiable data, then maybe there's hope where we've not seen it before.

What the heck . . . .
 
  • Like
Reactions: hoot1
Federal Reserve policies are primarily responsible for the largest income gap in 100 years and we currently have 93,000,000 out of work and an unsustainable consumer debt situation with the only benefactor of FED policies being corporations inflating the stock market with stock buybacks. Which part of that is the great job?

How is gold, oil and inflation working out for you? Have you ever been right with anything?
 
The obvious policy response when monetary policy is constrained by the ZLB: aggressive fiscal policy. Instead we've implemented contractionary fiscal policies since 2010.

313467-13329490942599604-One-Eyed-Guide_origin.jpg


NewGovtJobs2.jpg


See here and here.

Republicans are almost entirely to blame for this, having regarded textbook macroeconomics as a liberal plot and forestalling any effort to promote growth since they took the House and brought policy-making to an end. Stupid, stupid, stupid.

By the way, interest rates? Inflation?

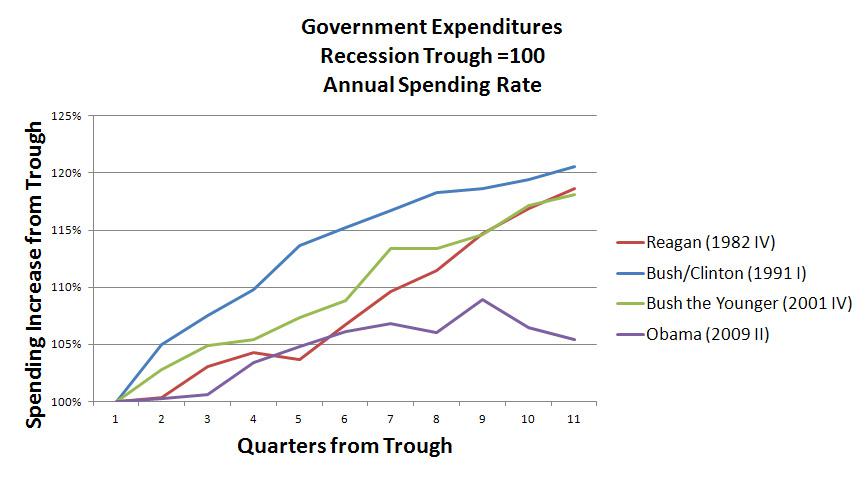
I'm interested in your fist graph. But I don't understand what is purports to show. Would you explain it?
 
Federal Reserve policies are primarily responsible for the largest income gap in 100 years and we currently have 93,000,000 out of work and an unsustainable consumer debt situation with the only benefactor of FED policies being corporations inflating the stock market with stock buybacks. Which part of that is the great job?

There are not 93 MM people looking for jobs. There are 93 MM people not working.

The income gap divergence begain in the late 70S and has continued
 
The source of the graph with related content is here. More here.

Then the graph really shows how miserable the Obama recovery is, not that we pursued poor policy

The graph shows all government spending. As you know, state and local spending is confined to revenues, because balanced budgets are required. Your link says that state and local spending is about 60% of total spending. So the graph really shows that 60% of the total spending level is structural and has nothing to do with choices or policy. Because state and local spending is largely a function of income (income tax) and consumer transactions (sales tax) what the graph really shows is that income and spending is in the dumper. This is different from the other robust recoveries graphed. Your graph is just another way of showing that the Obama recovery is the poorest in 100 years.

wow, that's really reaching there. Did you even bother to read the linked article?
 
wow, that's really reaching there. Did you even bother to read the linked article?
No, of course not. Despite his manifest incompetence on this subject, CO. Hoosier regards himself as the only source he requires. He also ignored this, which shows real federal spending declining after 2010, just as I said.
 
wow, that's really reaching there. Did you even bother to read the linked article?

It must be true because I read it on the internet

Of course I read the linked article. That is where the 60% came from for the state and local governmental spending in the graph. The author doesn't know much.

For example:

"The cut-backs in recent years in total government spending has been driven by cut-backs in spending at the state and local levels, many of whom have followed conservative fiscal policy either by statute (balanced budget requirements when revenues are falling) or by choice."
Balanced budget requirements are the result of state constitutions, not statutes. Doncha think Illinois would change the statute in nanosecond if all that was involved are statutes? The large blue states carry the most clout in terms of this data and they are by no means "conservative."

I read the article and review the data with a laser-like objective focus and draw the conclusions that the data show. You ought to try that some time.
 
Last edited:
No, of course not. Despite his manifest incompetence on this subject, CO. Hoosier regards himself as the only source he requires. He also ignored this, which shows real federal spending declining after 2010, just as I said.

Good grief

The graph you cited is only for government investment and consumption. That doesn't include transfer payments, benefits, and other entitlements. "real government spending" is not declining. According to you and Dr. Krugman, direct payments and benefits to or on behalf of individuals is the most effective government spending in terms of stimulus. Or have you changed your mind about that?
That is correct and I've posted this before to show that total government spending remains higher now than before or during the recession. The most effective form of stimulus might not be as stimulative as claimed.
 
It must be true because I read it on the internet

Of course I read the linked article. That is where the 60% came from for the state and local governmental spending in the graph. The author doesn't know much.

For example:

"The cut-backs in recent years in total government spending has been driven by cut-backs in spending at the state and local levels, many of whom have followed conservative fiscal policy either by statute (balanced budget requirements when revenues are falling) or by choice."
Balanced budget requirements are the result of state constitutions, not statutes. Doncha think Illinois would change the statute in nanosecond if all that was involved are statutes? The large blue states carry the most clout in terms of this data and they are by no means "conservative."

I read the article and review the data with a laser-like objective focus and draw the conclusions that the data show. You ought to try that some time.

But balanced budgets are subject to budgets. Governor Jindal in Louisina has essentially proposed no funding for state universities to pay for his tax cuts. Govenor Walker cut funding for the University of Wisconsin nd asked for funding in about the same level in tax breaks for a new Bucks stadium.
 
That is correct and I've posted this before to show that total government spending remains higher now than before or during the recession. The most effective form of stimulus might not be as stimulative as claimed.

Yes that chart exactly matches the original one...showing that govt spending has basically flat lined since 2010....unlike how the govt has responded to past recessions.

So congrats, you just confirmed Rocks post with further evidence.
 
It must be true because I read it on the internet

Of course I read the linked article. That is where the 60% came from for the state and local governmental spending in the graph. The author doesn't know much.

For example:

"The cut-backs in recent years in total government spending has been driven by cut-backs in spending at the state and local levels, many of whom have followed conservative fiscal policy either by statute (balanced budget requirements when revenues are falling) or by choice."
Balanced budget requirements are the result of state constitutions, not statutes. Doncha think Illinois would change the statute in nanosecond if all that was involved are statutes? The large blue states carry the most clout in terms of this data and they are by no means "conservative."

I read the article and review the data with a laser-like objective focus and draw the conclusions that the data show. You ought to try that some time.

As someone who works in the belly of the beast, in DOD budgeting, I'm fully aware of the specifc details. The GOP has had govt austerity as the backbone of their entire political strategy since 2010. It may well be populist based winning politics, but it's downright crap economics, and even worse efficient govt. I could fill this board with the horrible long term decisions I've seen that have been forced upon the bureaucracies in the last few years.

To the root point, do you believe in the general idea of Keynesian based macro economics? Because you talk about the weakest recovery ever, while also apparently supporting the fiscal policies of the last 5 years.
 
As someone who works in the belly of the beast, in DOD budgeting, I'm fully aware of the specific details. The GOP has had govt austerity as the backbone of their entire political strategy since 2010. It may well be populist based winning politics, but it's downright crap economics, and even worse efficient govt. I could fill this board with the horrible long term decisions I've seen that have been forced upon the bureaucracies in the last few years.

To the root point, do you believe in the general idea of Keynesian based macro economics? Because you talk about the weakest recovery ever, while also apparently supporting the fiscal policies of the last 5 years.

I don't have the time or the interest tonight to give you the answer your post deserves.

But I do have a few things to say.

First, no, I don't buy the theory that government spending a $1 on even totally useless things will inevitably produce, say, $2.50 in output. There is some historical data that makes things look this way. But as others have said, what people see is more like Escher's Waterfall; it is an appealing illusion, that's about it.

In the run up to the "great recession" we had huge spending bills for transportation and energy. In addition we were spending gobs on war. According to Keynesian theory, a recession should have been impossible. But as we know, other factors overwhelmed any positive effects of all that spending. Then we doubled down, with more spending in 2009, (stimulus and supplemental fiscal 2009 budgeted spending) and nothing of use happened. Meanwhile "safety net" spending was going through the roof, leading Dr. Krugman to opine that kind of spending was the most important stimulus. That didn't work either.

Then along comes sequester, which wasn't a cut, but merely a slowing in the rate of growth. Maybe you would call that austerity but I don't.

I do think there is some validity to the monetary part of the theory, the low interest rates. That would at least encourage spending now. But for reasons that have nothing to do with economic theory, that hasn't worked.

I think we find agreement in a couple of areas. First we waste bunches of money. Second we need to spend more on the right public works projects. To that end I have supported increases in federal and state excise taxes on fuel and tires. The problem here what spending we do devote to public works ends up in stupid, but stylish, projects, like high speed rail, transit, and the the bus lanes built by an earmark after the voters turned it down twice in my adopted home town. With transit, we are spending huge amounts on operations that are inefficient and not on captial projects that have a legit postive roi.

I think it is a huge mistake to blame the weakest recovery ever on congress. There are a number of factors that enter into it, including high corporate income taxes, the increasing regulatory state, in particular Dodd/Frank, and the general war on combustion.
 
Yes that chart exactly matches the original one...showing that govt spending has basically flat lined since 2010....unlike how the govt has responded to past recessions.

So congrats, you just confirmed Rocks post with further evidence.
No it doesn't match. It shows that total government spending is significantly more than before the recession and is higher than during the recession which included stimulus spending. The other chart implies that not only that spending isn't much more and relatively flat, but that it declined. That is not true for total. Spending as the chart I linked clearly shows.
 
No it doesn't match. It shows that total government spending is significantly more than before the recession and is higher than during the recession which included stimulus spending. The other chart implies that not only that spending isn't much more and relatively flat, but that it declined. That is not true for total. Spending as the chart I linked clearly shows.
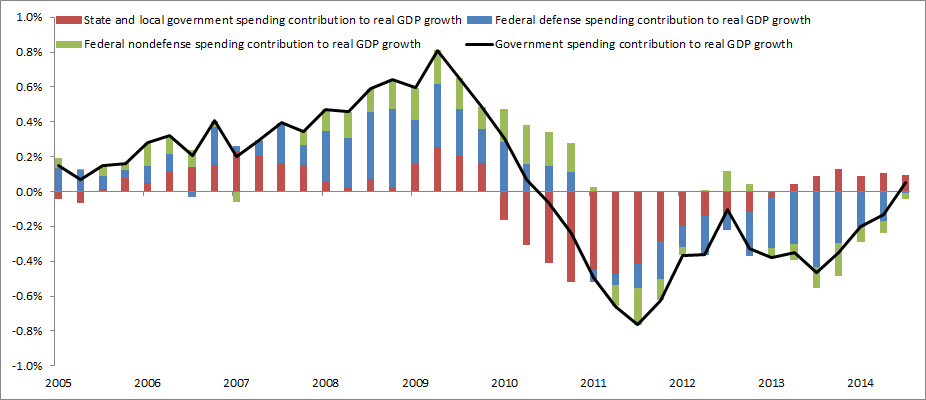
Your chart shows that nominal government spending has been flat since 2010. Real government spending has been negative. This sharply diverges from the long term historic trend of rising government spending. At precisely the time that we should have stepped on the gas, we stepped on the brake.

There isn't any doubt that fiscal policy has been a drag on the economy.

US-govt-spending-growth-contribution-detail.png


You guys don't get this because you won't get it.
 
Last edited:
Good grief

The graph you cited is only for government investment and consumption. That doesn't include transfer payments, benefits, and other entitlements. "real government spending" is not declining. According to you and Dr. Krugman, direct payments and benefits to or on behalf of individuals is the most effective government spending in terms of stimulus. Or have you changed your mind about that?
GDP = C + I + G + NX. I just gave you G. And it makes sense to focus on G because that's discretionary government spending. It's the spending that's responsive to short run policy decisions. And it went down at precisely the time that it should have gone up. It tells the very story that you won't hear.

Also, no Dr. Krugman and I don't believe that "direct payments and benefits to or on behalf of individuals is the most effective government spending in terms of stimulus." That's because individuals will save some of the funds they're given. Government transfers to liquidity-constrained consumers are a much more effective form of stimulus than tax cuts, but they're less effective than direct government purchases of goods and services, all of which is spent. That's why I keep talking about infrastructure investment: It's an extremely effective form of stimulus, plus it buys you a bright shiny new 21st-century infrastructure that enhances future prosperity.

Finally, yes, federal transfer payments did rise, just as they're supposed to. But these increases were being offset by sharp spending cuts at the state and local level. Automatic stabilizers aren't sufficient to offset the effects of a severe recession -- as everyone understood until Republicans decided to become invincibly ignorant of textbook macroeconomics.
 
First, no, I don't buy the theory that government spending a $1 on even totally useless things will inevitably produce, say, $2.50 in output. There is some historical data that makes things look this way. But as others have said, what people see is more like Escher's Waterfall; it is an appealing illusion, that's about it.
It's irrelevant whether you "buy it", because you have no idea what you're talking about. As an economist, you're a lousy climate scientist.
 
Total government spending is up $140 Billion over the 2010. If $140 billion more is nothing, people will be shocked if we ever really increase spending!

If that graph was viewed by liberals like they way they view global temp graphs we'd be hearing about how spending trending toward a horrible disaster and we need to control spending now.

I'm not opposed to spending more on infrastructure and think we should have done so for the fiscal stimulus rather than on most of the things that were included. Didn't happen. The Democrats didn't need Republicans to make it happen, though they would have gotten some if they had tried to do more actual infrastructure rather than Democratic pet projects, but they didn't make it happen. Then they burned their political capital and any possible hope of bipartisan cooperation with their focus on the ACA which more than half the country was opposed to focusing on at the time. It would have been much better to focus on the economy. They didn't. We should reprioritize spending and add more infrastructure (in addition ot the transportation spending they have continued to fund). I'm not even opposed to some sensible tax increases to pay for it.
 
ADVERTISEMENT

Latest posts

ADVERTISEMENT